National Bank Financial (NBF) Energy’s Before the Bell newsletter provided a couple interesting charts, perfectly titled: Houston…we have a problem.
And we well may. Where is the big, promised production growth? No really, where is it?

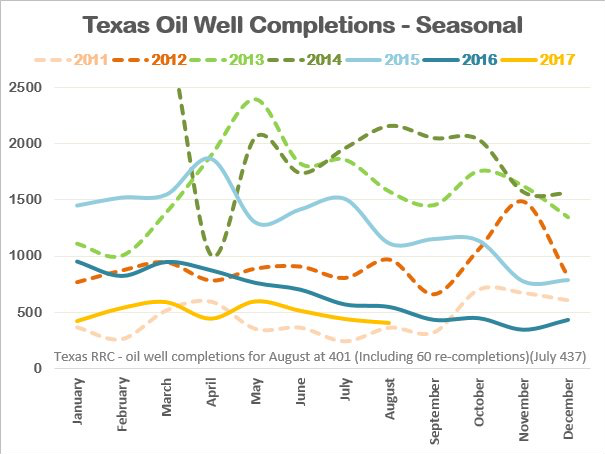
Another interesting and complementary chart is the Seasonal Texas Oil Well Completions graph. As you can see, 2017 is well below even the 2016 completion rate, although NBF advises they have seen data of DUC inventory in shale, which suggests that as prices rise there could be more completed wells and their associated volumes.
We’re all for rising oil prices, so we’ll wait to see what happens.
The post The O&G production story in charts appeared first on TAG Oil.